Are you looking for the extra edge when meeting with clients? Look no further! The introduction of Showing Data integrated with Market Stats has just given you a new advantage—being able to provide your customers with information few others are actually currently using!
To get started, choose the Market Stats option from the Realcomp Dashboard.
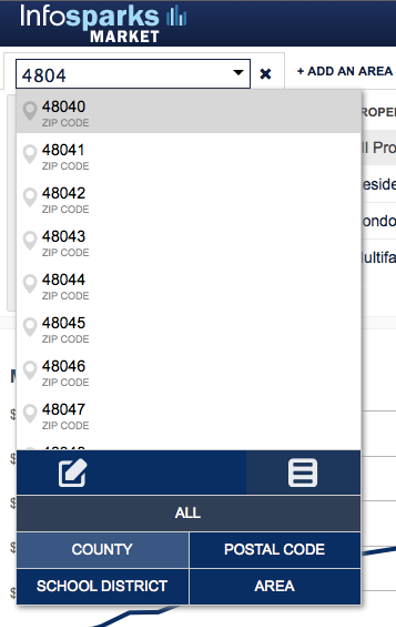
While viewing the first screen, you have the option to refine your results by choosing a specific area.

Available filters include county, postal code, school district and MLS area.
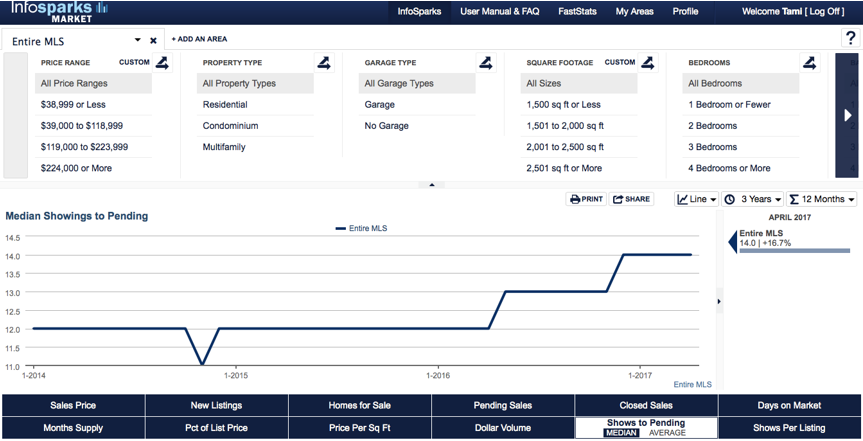
Continue to filter your results based on criteria such as: Price Range, Property Type, Garage Type, Square Footage, Bedrooms, Bathrooms, and/or Square Footage).

Click the option “Shows to Pending” to view either the Median or the Average number of showings that take place per listing until the property is updated to the Pending status.

Click the “Shows Per Listing” option to view the Average number of showings that take place per listing.
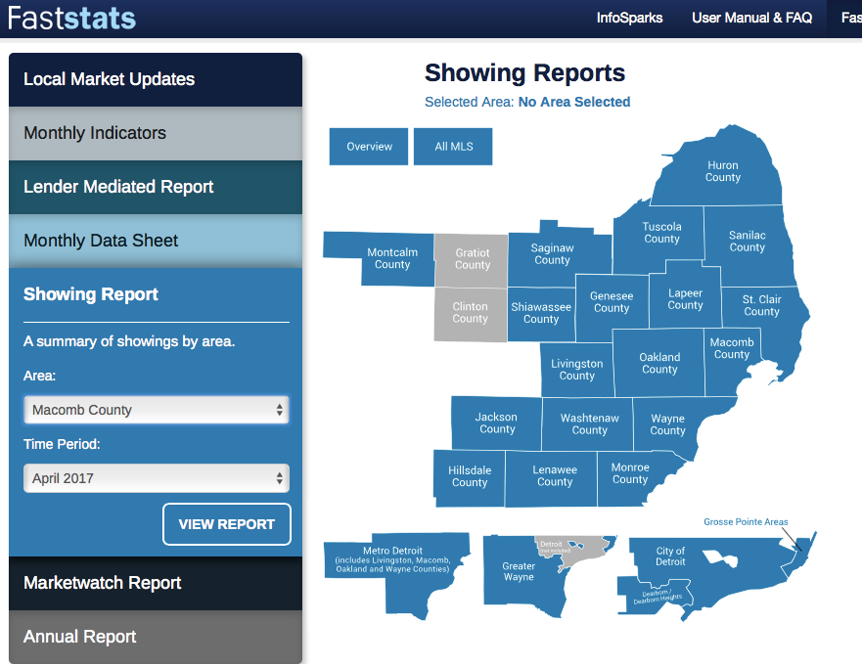
To dig deeper into Showing Information, choose FastStats from the top menu bar.

Choose Showing Report on the left side of the screen (shown above).
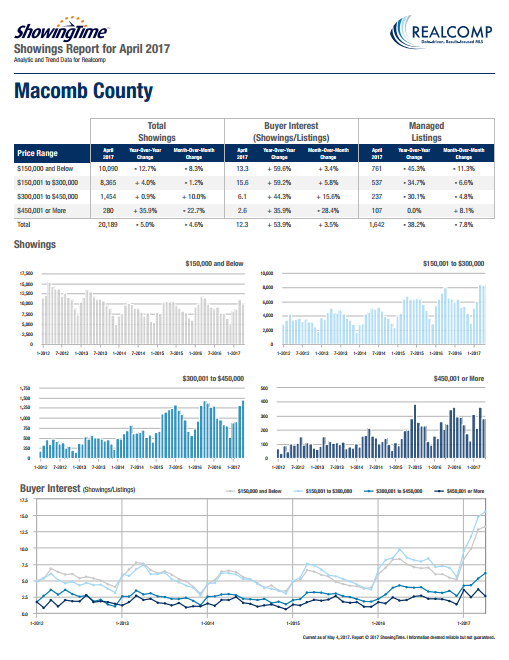
Refine your report options by choosing your Area and Time Period preferences. A sample report (i.e. Macomb County) is shown below.

Showing insights open up a whole new world of possibilities when it comes to sharing market statistics with your customers and clients. This can be an excellent resource to report the average number of the showings that are occurring in the area before a property sells.
An excellent resource for buyers’ agents to share with their buyers to review how many other showings on average take place on properties, as well as the average sale price.
Realcomp is proud to partner with ShowingTime to continue to bring you state-of-the art MLS Data and intelligence.
|