January Jump: Detroit Dominates Local Marketplace
Median Sales up more than 32% in City

January – National Real Estate Commentary
The 2022 real estate market begins where 2021 left off, in which existing home sales reached their highest level
since 2006, with the National Association of REALTORS® reporting sales were up 8.5% compared to the
previous year as homebuyers rushed to take advantage of historically low mortgage rates. Home sales would’ve
been even greater were it not for soaring sales prices and a shortage of homes for sale in many markets, forcing
a multitude of buyers to temporarily put their home purchase plans on hold.
For many buyers, 2022 marks a new opportunity to make their home purchase dreams a reality. But it won’t be
without its challenges. Inventory of existing homes was at 910,000 at the start of the new year, the lowest level
recorded since 1999, according to the National Association of REALTORS®, and competition remains fierce.
Affordability continues to decline, as inflation, soaring sales prices, and surging mortgage interest rates reduce
purchasing power. The sudden increase in rates and home prices means buyers are paying significantly more
per month compared to this time last year, which may cause sales to slow as more buyers become priced out of
the market.
January – Local All MLS Numbers
Closed Sales decreased 9.6 percent for Residential homes and 2.3 percent for Condo homes. Pending Sales
decreased 9.3 percent for Residential homes and 6.1 percent for Condo homes. Inventory decreased 9.2 percent
for Residential homes and 36.6 percent for Condo homes.
The Median Sales Price increased 7.6 percent to $209,900 for Residential homes and 21.3 percent to $218,375
for Condo homes. Days on Market decreased 25.0 percent for Residential homes and 34.6 percent for Condo
homes. Months-Supply of Inventory decreased 9.1 percent for Residential homes and 42.1 percent for Condo
homes.

January – Local All MLS Numbers - Cont’d
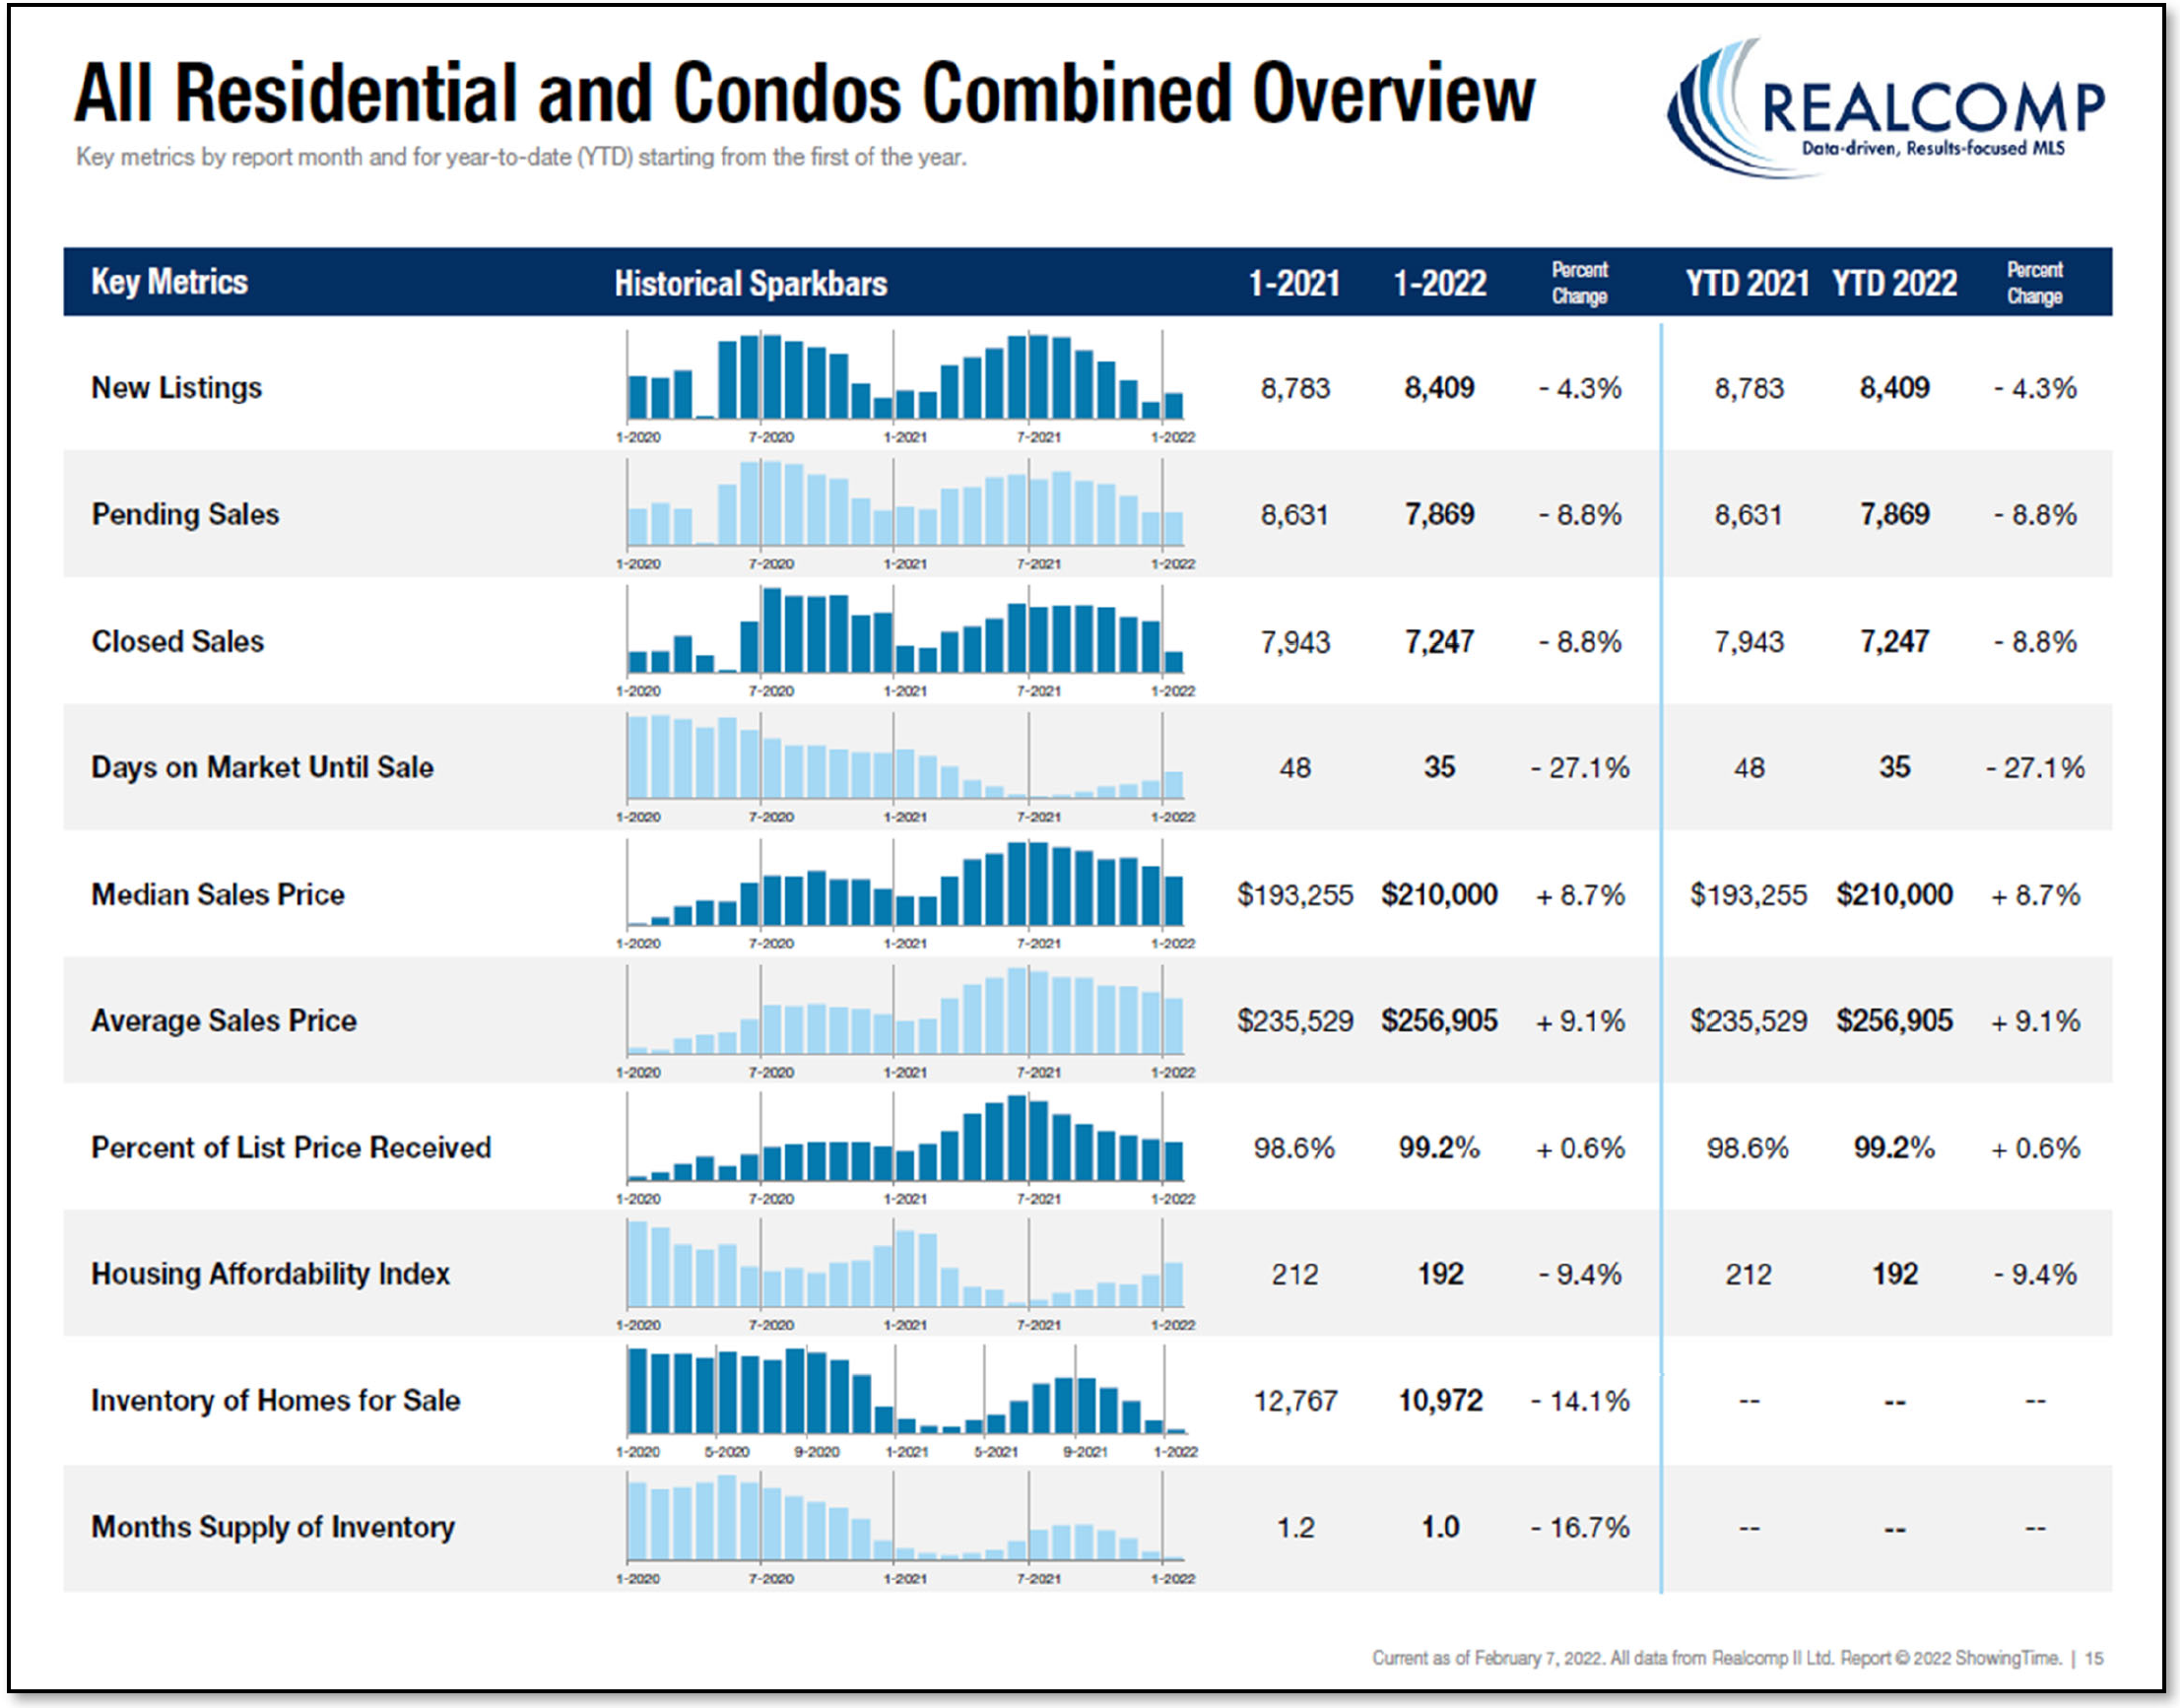
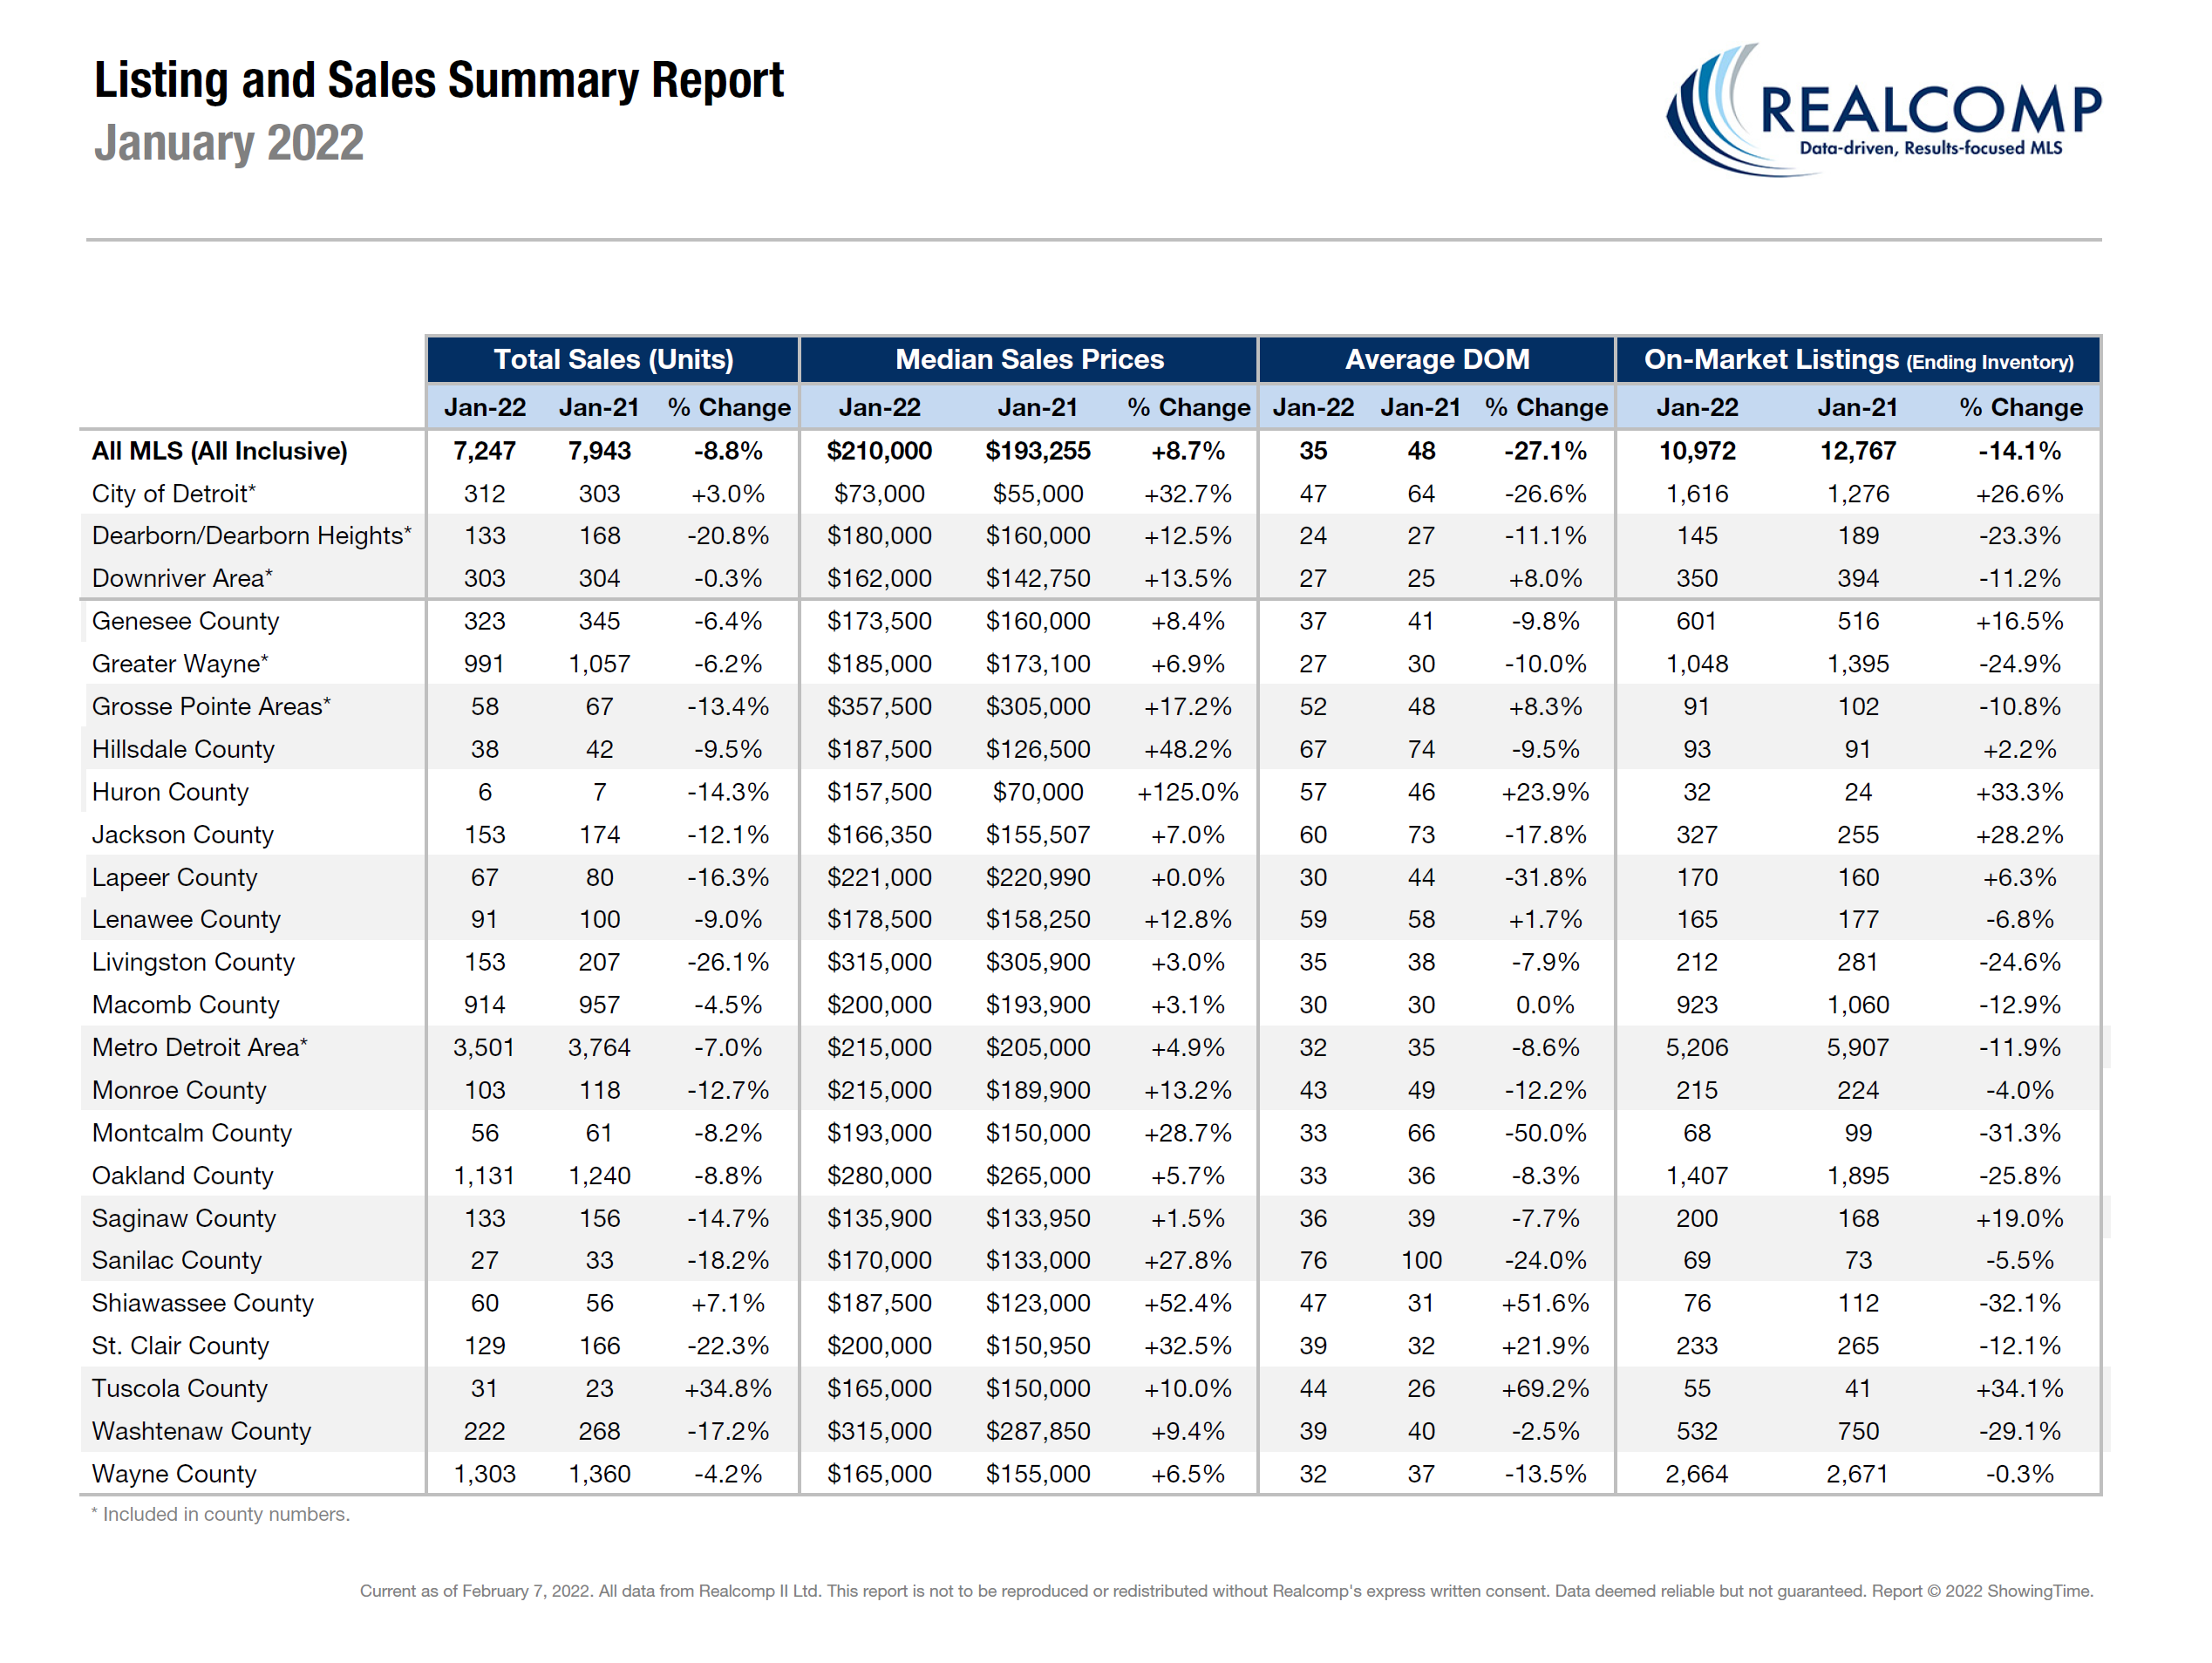
- Median Sale Price was up by 8.7% from $193,255 to $210,000.
- The average days on market (DOM) decreased by 27.1% from 48 to 35 days.
- The average % of the last list price received increased by 0.6% from 98.6% to 99.2%.
- New Listings decreased by 4.3% from 8,783 to 8,409.
- Average Showings per Home increased from 11.3 to 13.3.
- Pending Sales were down by 8.8% from 8,631 to 7,869.
- Closed Sales were down by 8.8% from 7,943 to 7,247.
- Listings that were both listed and pended in the same month were at 3,951. This represents 47% of the new listings for the month and 50.2% of the pended listings.
- Months-Supply of Inventory was down by 16.7% from 1.2 to 1.0.
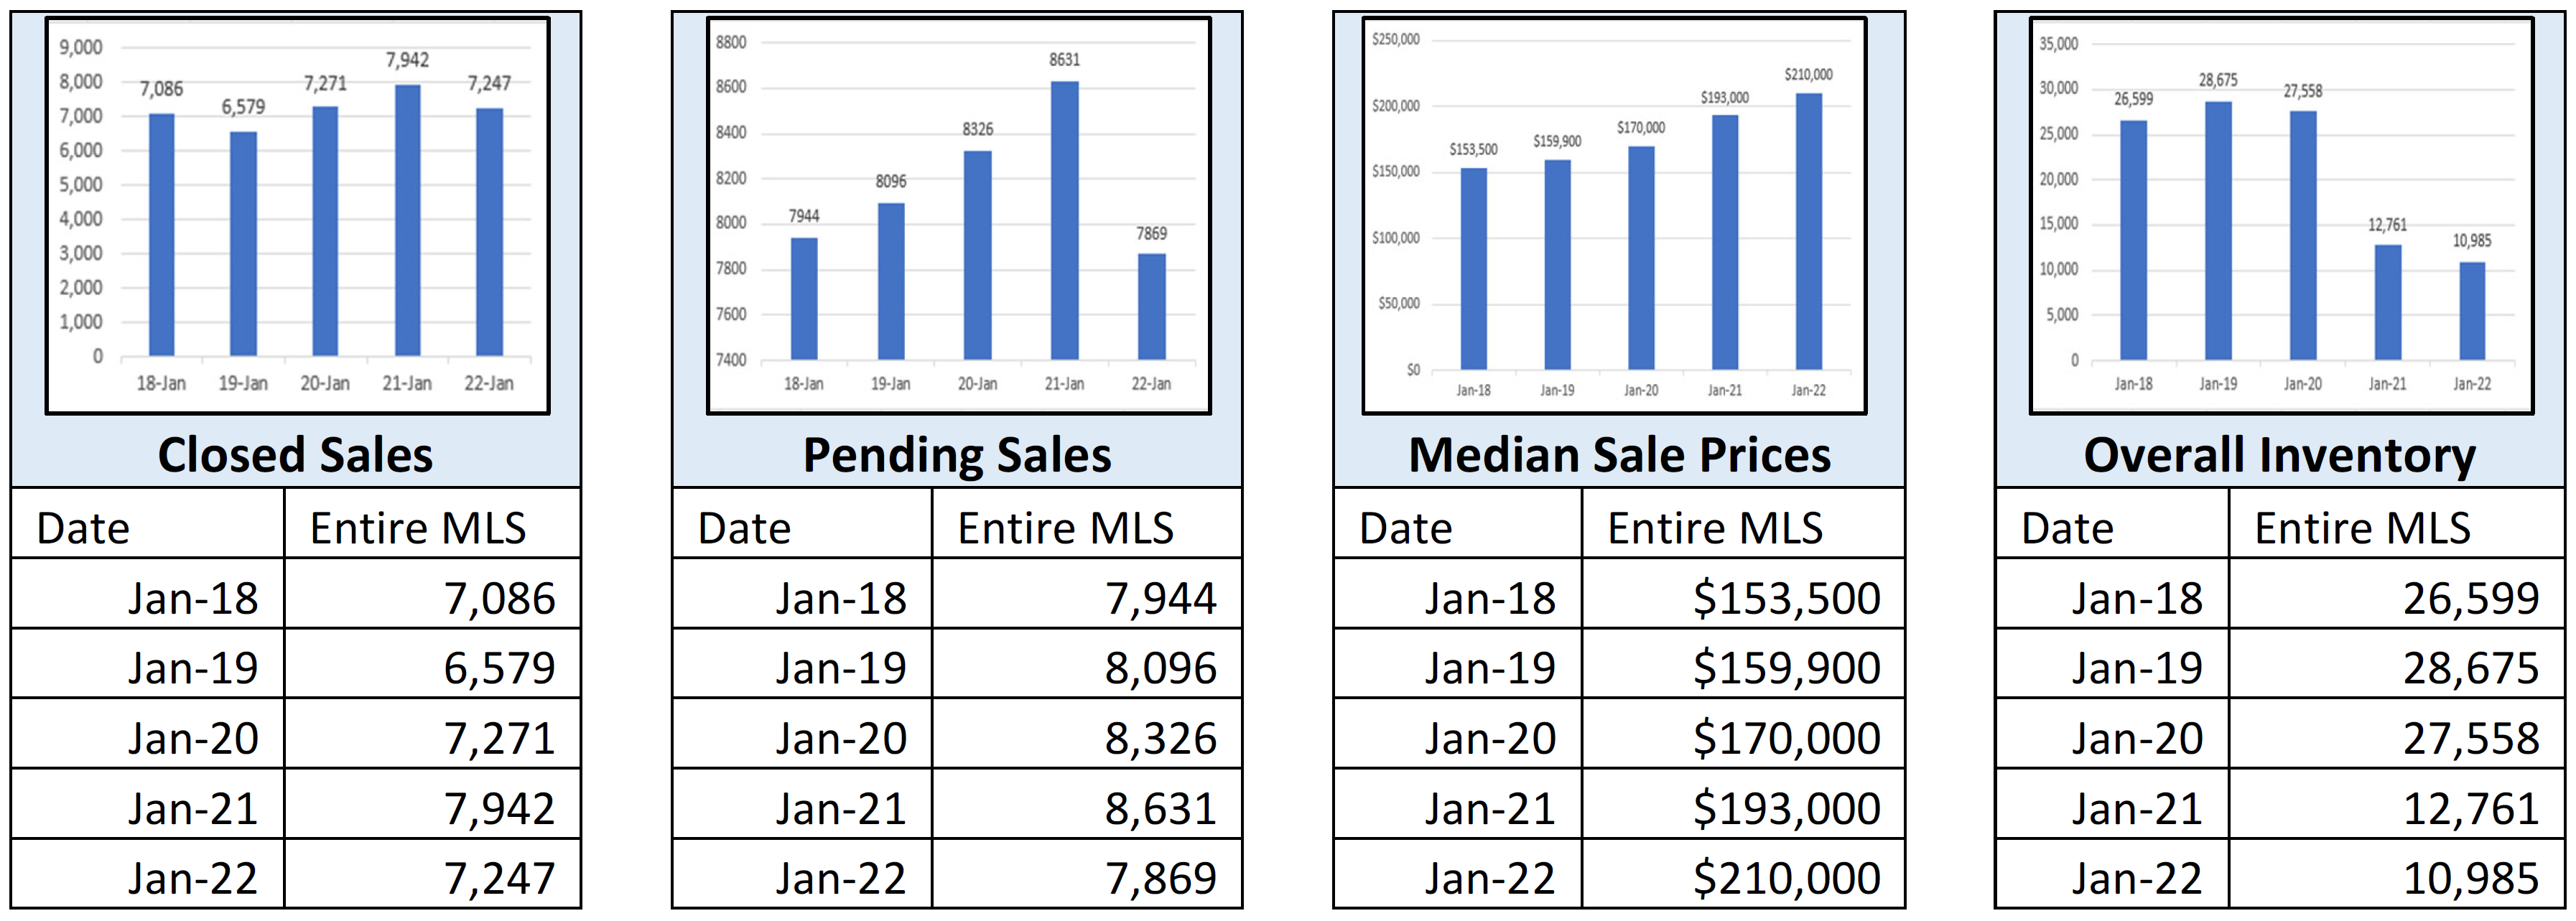
January 5-Year Perspectives -- Local All MLS Numbers


